WARDS & MARKETS
Tokyo's Redevelopment Supercycle: Every Major Project, Mapped
A buyer's map of Tokyo's redevelopment wave — Azabudai, Toranomon, Shibuya, Yaesu/Nihonbashi, Shinagawa/Takanawa, the Bay, and Nishi-Shinjuku — who's building, when it finishes, and what it does to nearby property values.
On this page 11
- Why a “supercycle,” not just a building boom
- Azabudai and Toranomon: the Mori Building corridor (Minato)
- Shibuya: a once-in-a-century rebuild on a 2034 clock (Shibuya)
- Yaesu and Nihonbashi: the Tokyo Station east flank (Chuo / Chiyoda)
- Shinagawa and Takanawa Gateway: the JR East and maglev bet (Minato / Shinagawa)
- The Bay: Toyosu, Harumi, Ariake — scale and yield (Koto / Chuo)
- Who’s who on the water
- Harumi Flag: the legacy asset that actually delivered
- The bay numbers, plainly
- Nishi-Shinjuku: the slow giant (Shinjuku)
- How to actually use this map
TL;DR: Tokyo is in the middle of a once-in-a-generation redevelopment wave — roughly a decade of mega-projects clustered along a handful of rail nodes, mostly funded by three developers with deep pockets. The pattern is consistent and tradeable: land within walking distance of a finished or near-finished project reprices upward, and the gap between “announced” and “complete” is where the value compounds. This is your map of where that is happening, who is building, and when.
Why a “supercycle,” not just a building boom
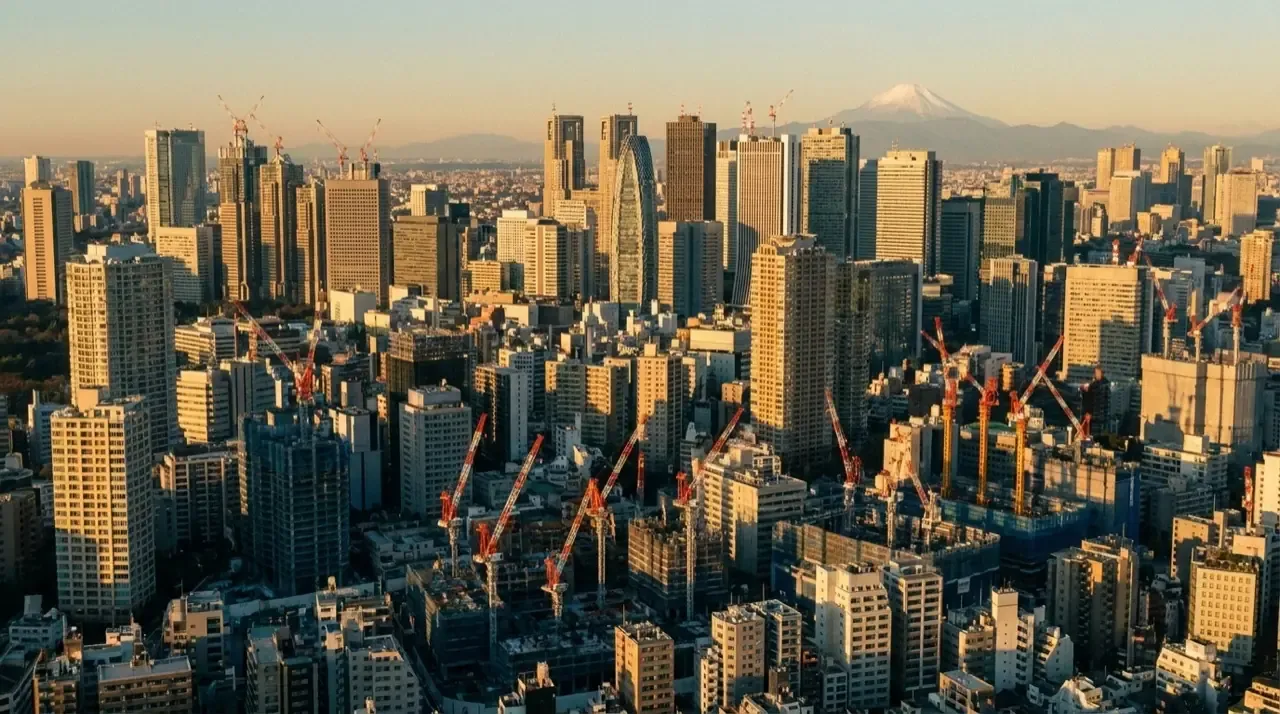
Tokyo always has cranes up. What makes this different is concentration and scale. A handful of nodes — Azabudai, Toranomon, Shibuya, the Yaesu/Nihonbashi side of Tokyo Station, Shinagawa/Takanawa, the Bay, and Nishi-Shinjuku — are being rebuilt more or less simultaneously, on 10-to-20-year clocks, by the same small club: Mori Building, Mitsubishi Estate, Mitsui Fudosan, Tokyu, and JR East.
The macro backdrop is doing the heavy lifting for buyers. Official land prices in central Tokyo’s five core wards rose about 12% in 2025, with commercial land in Chuo-ku up roughly 13.9% and Minato-ku about 12.7% (directional, as of writing). New-build condo prices in the 23 wards hit a record average around 138 million yen in fiscal 2025, up roughly 18% year-on-year, while new supply fell to its lowest since 1973. Scarce supply plus a weak yen plus a structural pipeline of trophy buildings is the whole story. Redevelopment is the visible, mappable edge of it.
The honest caveat up front: these figures are directional and the gains are not evenly spread. A tower three minutes from a finished Hills project behaves nothing like a walk-up fifteen minutes away. The map matters more than the headline.
From the desk — In a decade of walking buyers through these nodes, the mistake I see most is treating the announcement as the trade. The people who do well are the ones who buy while the cranes are still up and the hoarding is ugly, then hold through the ribbon-cutting, because by the time the lobby photos look good, the walkable-radius premium has already left the table.
Azabudai and Toranomon: the Mori Building corridor (Minato)
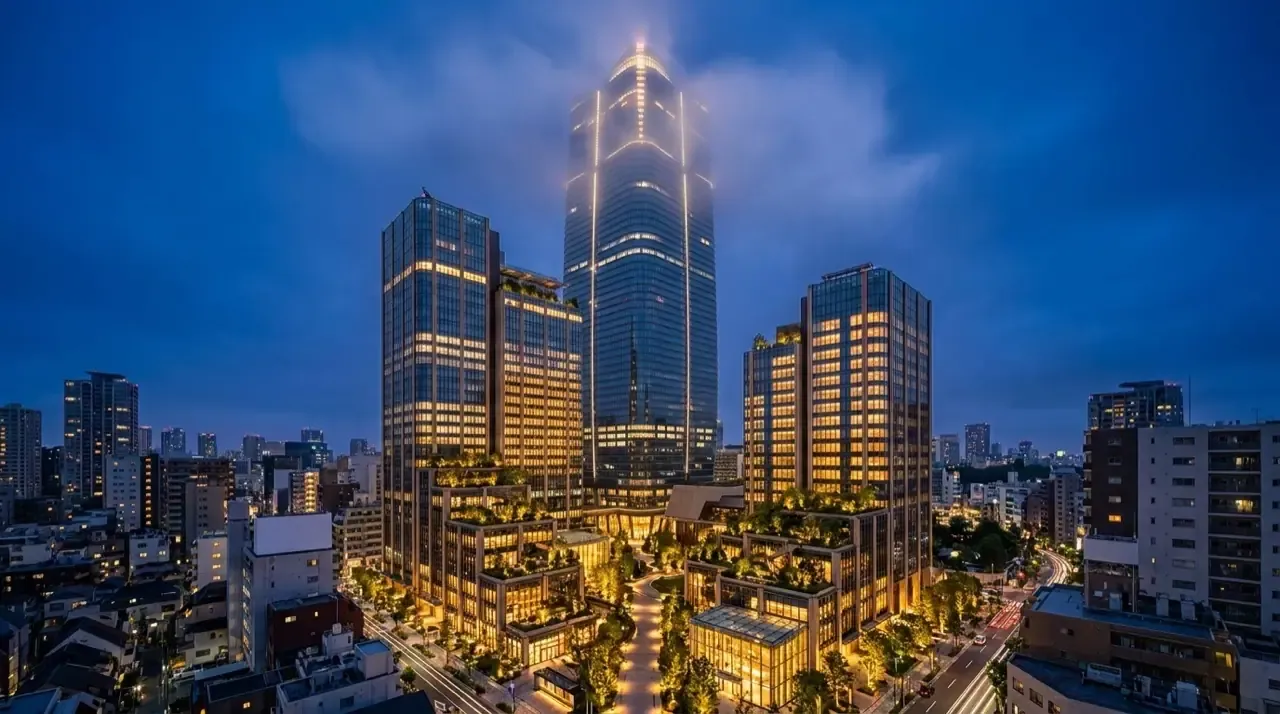
This is the center of gravity. Azabudai Hills completed its core in 2023 and reached full completion in 2025 with its second residential tower. The centerpiece, Mori JP Tower (about 325m, ~64 floors), is Japan’s tallest building, built by Mori Building at a project cost near 640 billion yen. It packs office, an Aman hotel and the Aman Residences on the top floors, a British School campus, and high-end retail into one podium — directional figures, as of writing.
Ten minutes’ walk away, Toranomon Hills finished its fourth and final piece, the Station Tower (about 266m), in 2023, integrated directly with a remodeled Toranomon Hills station. Mori has effectively built a continuous high-end district stitching Toranomon to Azabudai.
What it does to value: this corridor has become Minato’s premium core. The pattern to understand is that Mori does not just build a tower — it builds a branded micro-city with international schools, embassies nearby, and luxury retail, which pulls a global tenant and buyer base. Resale and rental premiums radiate outward from these podiums. If you are buying for a foreign-facing rental or an owner-occupier base in Tokyo, this is the most legible “land value compounding” zone in the city. See our Minato ward deep-dive for the block-by-block picture.
Shibuya: a once-in-a-century rebuild on a 2034 clock (Shibuya)
Shibuya is Tokyu’s project, and it is genuinely long. The full station-area redevelopment is now scheduled to run to about fiscal 2034 — pushed back from an earlier 2027 target. That long runway is the opportunity: the area is being repriced in stages, not in one event.
Already delivered: Shibuya Sakura Stage (the Sakuragaoka side) opened in July 2024 — a large mixed-use complex with the 39-story Shibuya Tower and 30-story Sakura Tower, offices, retail, a Hyatt House, and a startup program. Next up, the Snohetta-designed Shibuya Upper West Project broke ground in March 2025 on the old Tokyu Department Store flagship site, targeting completion around 2029, with a hotel, rental residences, and the relocated Bunkamura museum.
What it does to value: Shibuya has shifted from youth-culture district to a credible office-and-residential core (“Greater Shibuya”), anchoring IT and creative tenants. Because completion is staggered to 2034, you are buying into a node where each opening is a fresh catalyst. The caveat: Shibuya is topographically messy and tightly held — inventory is thin and pricing is already rich.
Yaesu and Nihonbashi: the Tokyo Station east flank (Chuo / Chiyoda)
This is the most concentrated cluster of supertall ambition in the city. On the Yaesu side, Tokyo Midtown Yaesu (Yaesu Central Tower, about 240m) opened in 2022 under Mitsui Fudosan, with further Yaesu phases — including TOFROM YAESU (about 249m) — completing across 2025 and the 2-chome area around 2028.
The headline is just north: Mitsubishi Estate’s Torch Tower at Tokiwabashi, planned at about 385m, is slated to become Japan’s tallest building on completion around 2028 — observation deck, hotel, retail, the works. Alongside it, Nihonbashi 1-chome redevelopment (Mitsui Fudosan and Nomura) targets around 2026.
What it does to value: the Tokyo Station east side has historically lagged the Marunouchi (west) side. This wave is closing that gap deliberately. When Torch Tower tops out, expect a step-change in how Yaesu/Nihonbashi land is priced relative to Marunouchi — that re-rating is the trade. Note the risk: large-scale projects here have slipped before, and 2028 dates are targets, not guarantees.
Shinagawa and Takanawa Gateway: the JR East and maglev bet (Minato / Shinagawa)
This is the highest-optionality node on the map. Takanawa Gateway City, JR East’s roughly 600 billion yen complex (about 845,000 sqm), held its opening in March 2025, with office and residential towers up to ~172m and further phases — including the residence tower — opening into 2026.
The bigger catalyst is one stop south: Shinagawa Station is the planned Tokyo terminus of the Linear Chuo Shinkansen maglev to Nagoya (a ~40-minute trip), plus a Namboku line extension. The maglev timeline has slipped past its original 2027 target and remains uncertain — but the land has not waited.
What it does to value: Takanawa/Shinagawa is the area where the most future upside is still un-priced, precisely because the maglev is delayed. If you believe the line eventually opens, today’s prices look early. The honest caveat: this is the most speculative node here — buy it on the standalone strength of Takanawa Gateway City and treat the maglev as a free option, not the thesis.
The Bay: Toyosu, Harumi, Ariake — scale and yield (Koto / Chuo)
The waterfront is the volume play. Tokyo Bay — Toyosu, Harumi, Kachidoki, Ariake, Shinonome — holds the city’s heaviest concentration of new-build tower supply. Harumi Flag, the 18-hectare post-Olympic redevelopment with 24 buildings, is the marquee project; second-hand prices per tsubo in Kachidoki/Harumi have pushed past 5 million yen in recent transactions (directional, as of writing).
Here’s the structural reason the bay matters in a supercycle map: central Tokyo barely builds anymore. New-condo supply keeps shrinking, which is exactly why existing-condo prices are climbing faster than new ones. The bay area is the opposite — it’s Tokyo’s last large-scale blank canvas. Koto ward, which holds Toyosu and Ariake, has the newest average building stock in the entire city (directional, around 4 years old as of writing). If you want a genuinely new tower with modern earthquake engineering, big floor plates, and resort-grade amenities, you buy on the water. You can’t get it in Azabu at any sane price. So this isn’t a discount bin. It’s a different product: newer, bigger, greener, and aimed squarely at families rather than at people buying an address.
Who’s who on the water
Think of the bay belt as four distinct neighborhoods, not one blob.
Toyosu (Koto-ku). The mature anchor. It has the train line everyone else wishes they had — the Yurakucho Line gets you to Ginza and Otemachi in roughly 20 minutes — plus the famous Toyosu Market (the fish market that replaced Tsukiji), the teamLab Planets museum, and the LaLaport mall. Toyosu is the most liquid, most proven bay market. It logged the highest transaction count of any rising-price district in the 23 wards in 2025, and prices rose roughly 88% over five years to about 1.84m yen/sqm (directional, as of writing). When foreigners ask me where to start on the bay, this is usually the answer.
Ariake (Koto-ku). Younger, more spacious, more “planned city.” Wide streets, Ariake Garden (a huge mall-plus-hotel-plus-spa complex), parks, and waterfront promenades. Towers here lean hard into family amenities — kids’ rooms, nurseries, sky lounges, guest suites. The trade-off is transport: Ariake leans on the Yurikamome and Rinkai lines, which are fine but not the Yurakucho Line. You’re buying space and newness over commute speed.
Harumi (Chuo-ku). This is the interesting one, because Harumi is technically in Chuo — a central ward — but functions like a bay island. It’s home to Harumi Flag, the converted Olympic Village. Harumi’s blessing and curse is the same fact: no train station on the island. The nearest, Kachidoki, is a 17-to-22-minute walk, bridged for now by bus and BRT.
Shinonome / Tatsumi. The quieter, value end. Less glamour, lower prices, solid family stock. Worth a look if you want bay-area newness without paying the Toyosu premium.
Harumi Flag: the legacy asset that actually delivered
If you read one bay-area case study, make it this. Harumi Flag is the repurposed 2020 Olympic Village — Japan’s largest condominium complex, around 5,600 units across 24 buildings on roughly 18 hectares. Skeptics (me included, early on) doubted that anyone would want to live on a train-less island. The market answered.
Demand at launch was frenzied — some units drew well over a hundred applications each, because the developers priced the initial release below what comparable new Tokyo stock was fetching. Occupancy began in January 2024, and the population is filling toward roughly 12,000 residents. By mid-2024, an NHK investigation found nearly 20% of one tranche of units (about 491 of 2,690) were already being rented out or resold for investment — a blunt signal that buyers saw flip-and-rent upside, and got it.
The honest caveat: Harumi Flag’s early gains came partly from that deliberately low launch price. Don’t assume the next bay project repeats a one-off Olympic discount. But as a proof of concept — that Tokyo families and investors will absolutely buy a train-less waterfront island if the product and price are right — Harumi Flag settled the argument.
The bay numbers, plainly
The comparison that actually matters, central wards vs the bay (all directional, as of writing):
- Per-square-meter price. Central premium wards (Minato, Chiyoda, Chuo core) run roughly 2.3-4.5m yen/sqm. Toyosu sits around 1.84m yen/sqm. You’re paying meaningfully less per meter on the bay — and getting newer, bigger units for it.
- Rent. A 1LDK runs about 270,000-360,000 yen/month in Minato, 220,000-290,000 in Chuo, and 190,000-240,000 in Koto. Lower rent, but also a much lower entry price.
- Yield. The bay is not Tokyo’s top-yield zone — that’s the cheaper east, like Sumida/Kinshicho near 5%+ gross. But the bay beats the trophy wards on pure yield. Azabu and Aoyama are gorgeous places to own and lousy places to collect rent; the capital required there rarely pencils out against income. The bay’s newer towers and steady family demand support rent well enough to make the math defensible.
What it does to value: the Bay gives you bigger units, newer buildings, and better headline yield than the central trophy nodes, at lower price-per-sqm — at the cost of longer commutes and reclaimed-land considerations. Modern towers here are piled to bedrock with reinforced foundations specifically to handle liquefaction — that’s not marketing, it’s why the building boom concentrated here — but read the building’s seismic spec before you sign, and check the actual walk to the actual station, not the brochure’s “area access.” It is the most accessible entry point for a first Tokyo purchase, and the Harumi Flag fill-up plus Toyosu’s city-leading transaction volume have already proven the demand. Run the numbers on our yield and cost tools before committing.
Nishi-Shinjuku: the slow giant (Shinjuku)
Shinjuku handles the world’s busiest station, and its west side is finally being rebuilt. The centerpiece West Exit tower (about 260m, 48 floors) began construction in 2024, targeting completion around fiscal 2029, with the broader “Grand Terminal” and walkable-plaza vision extending into the 2040s.
What it does to value: Nishi-Shinjuku is currently underpriced relative to its transit power. This is a patience trade — the catalysts are years out, but the entry is cheaper than Shibuya or Minato for comparable connectivity.
How to actually use this map
The repeatable pattern across every node: announcement is priced in slowly, completion is priced in fast, and the walkable radius around the podium re-rates hardest. Your edge as a buyer is timing the gap — owning land near a project that is funded and under construction but not yet open.
Where each node sits today, directionally: Azabudai/Toranomon — mature, premium, lowest risk. Shibuya — staged catalysts to 2034. Yaesu/Nihonbashi — re-rating into 2028 on Torch Tower. Shinagawa/Takanawa — highest optionality, maglev as a free call. The Bay — best yield and easiest entry. Nishi-Shinjuku — cheapest patience trade.
Pick the node that matches your hold period and risk tolerance, then go narrow: walk the specific blocks, pull comparable transactions, and pressure-test the yield. Start with our ward guides to size each node, compare two areas side by side, and model the actual numbers with our buyer tools. The supercycle is real and it is mapped — your job now is to plant a flag on it before the next ribbon gets cut.
Sources: Japan Property Central — Harumi Flag, Harumi Flag — Wikipedia, note.com — Top 10 rising-price districts in Tokyo, PLAZA HOMES — Ariake/Shinonome/Daiba area guide, PropertyAccess — Tokyo 23 wards price per sqm 2026, E-Housing — Tokyo disaster risk by ward, Bamboo Routes — Tokyo rental yields 2026, PLAZA HOMES — Tokyo rent prices 2025.